Intensity Forecast
The Official Intensity Forecast Errors and Skill Scores of IMD/ RSMC New Delhi for the tropical cyclones (maximum sustained wind speed 34 kts and above) during 2005 to 2025 are shown in Fig.1 a to d and Table 1 & 2 respectively. The figures indicate marginal improvement in the cyclone intensity forecast over north Indian Ocean. Five year moving average Absolute & Root Mean Square intensity forecast errors (kts) and Skill in % based on Absolute and Root Mean Square intensity forecast errors for the cyclones during 2005-2025 are shown in Fig. 2(a-d).
For details about the verification methods and the results, following research article may be referred:
M. Mohapatra, B.K. Bandyopadhyay , D.P. Nayak, 2013, Evaluation of Official Tropical Cyclone Intensity Forecast over north Indian Ocean Issued by India Meteorological Department, Natural Hazards, 68, pp 433-451.
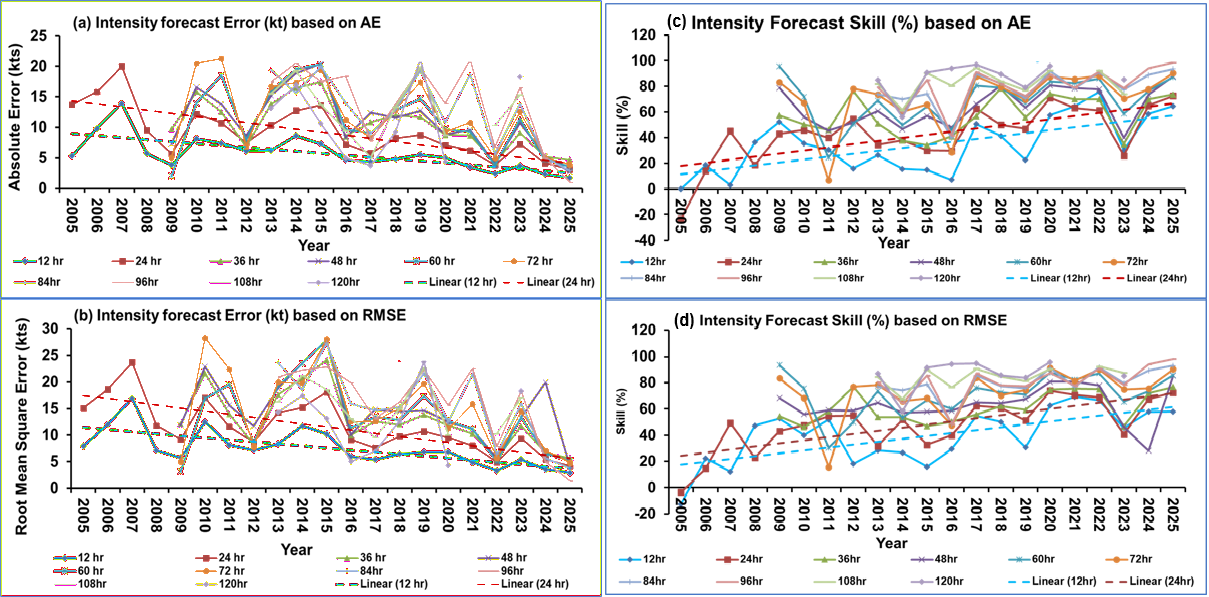
Fig.1: Annual average (a) Absolute & (b) Root Mean Square intensity forecast errors (kts) and (c) Absolute & (d) Root Mean Square Skill (%) compared to persistence based errors for TCs over north Indian Ocean during 2005-25.
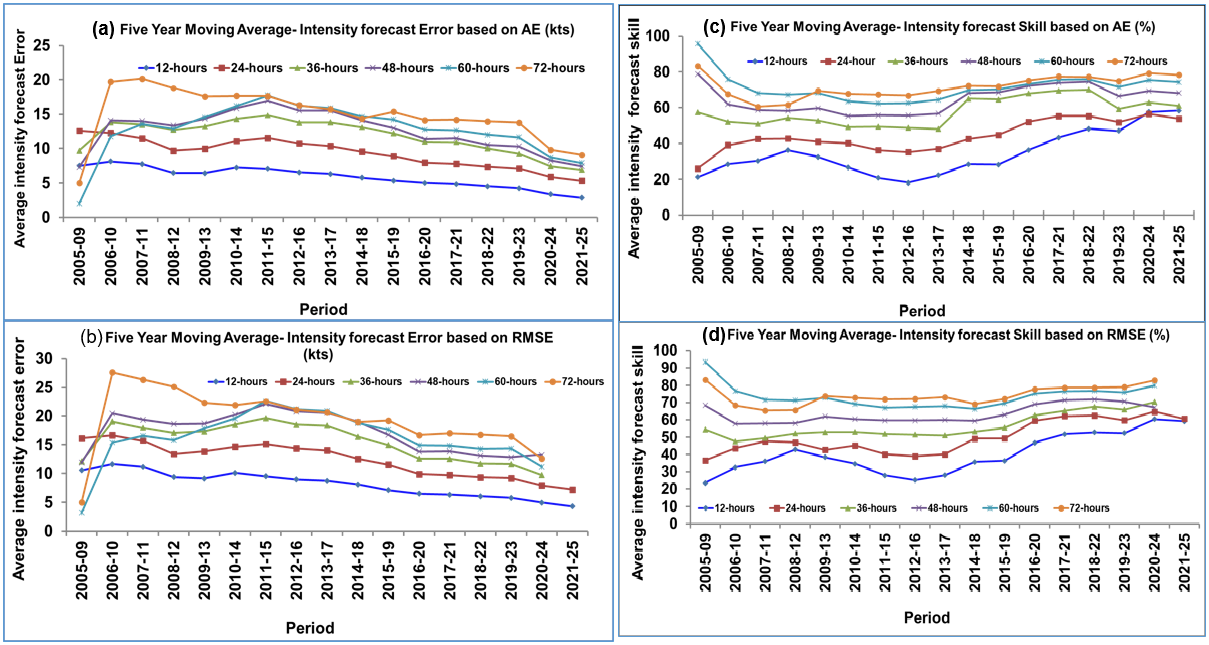
Fig.2: Five year moving average (a) Absolute & (b) Root Mean Square intensity forecast errors (kts) and Skill in % based on (c) Absolute and (d) Root Mean Square intensity forecast errors for the cyclones during 2005-2025
Table1a: Annual Average Absolute Intensity Forecast Errors (kts) for TCs over north Indian Ocean during 2005-25.
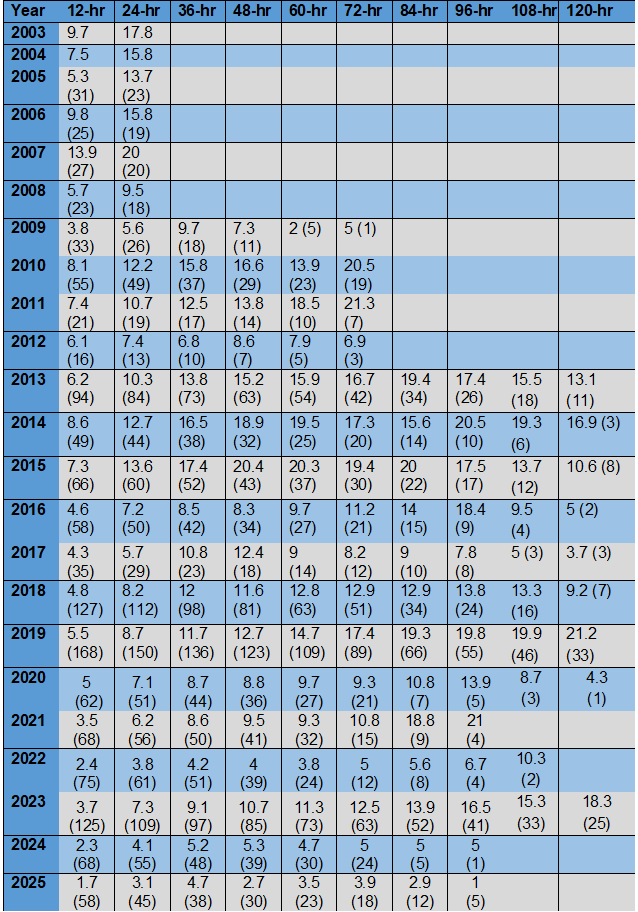
Table1b: Annual Average Root Mean Square Intensity Forecast Errors (kts) for TCs over north Indian Ocean during 2005-25.
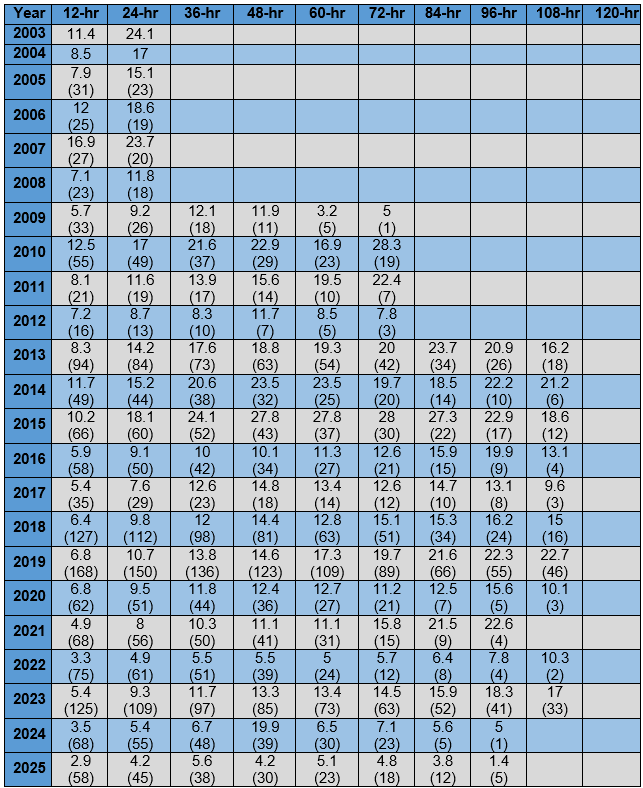
Table2a: Annual Average Absolute Intensity Forecast Skill (%) for TCs over north Indian Ocean during 2005-25.
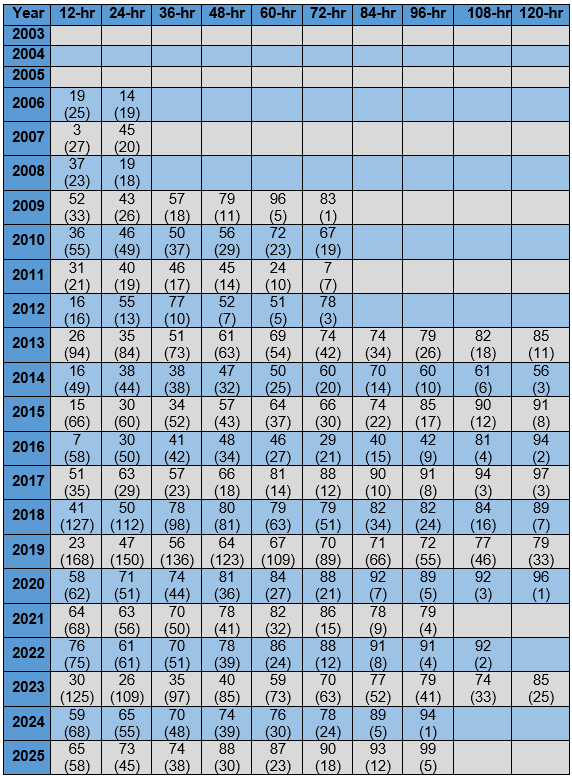
Table2b: Annual Average Root Mean Square Intensity Forecast Skill (%) for TCs over north Indian Ocean during 2005-25.
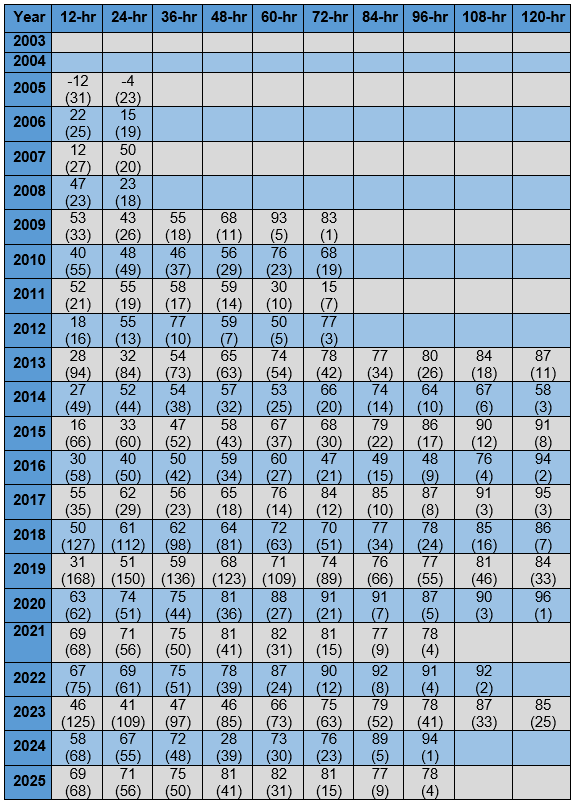
Intensity forecast issued upto 72 hours since 2009 and 120 hours since 2013.